LOOKER-BUSINESS-ANALYST Online Practice Questions and Answers
An analyst pins a dashboard from a personal folder to the team board. Other colleagues report that they cannot access the dashboard. There are a few dashboards in the personal folder that are not ready to share yet.
What should the analyst do to enable the team's access?
A. Give all users view access to the personal folder.
B. Move the dashboard to a shared folder and provide access only to the users from the team.
C. Give view access to the individual dashboards.
D. Create a subfolder in the personal folder and given view access to the users from the team.
An analyst has an Explore query that shows the sum of spend over time. The Explore query has the Sum of Spend measure pivoted by a Category of Spend dimension. The Category of Spend dimension has a value for Budgeted Spend and then categories for each type of unbudgeted spend.
Which visualization feature should the analyst use to separate budgeted spend visually from each category of unbudgeted spend?
A. Display row totals for each category.
B. Series type customization on budgeted spend.
C. Grouped series positioning on budgeted spend.
D. Transpose table to separate out budgeted spend.
An analyst needs to compare monthly sales, year over year, based on when an order was created, as shown in the exhibit.
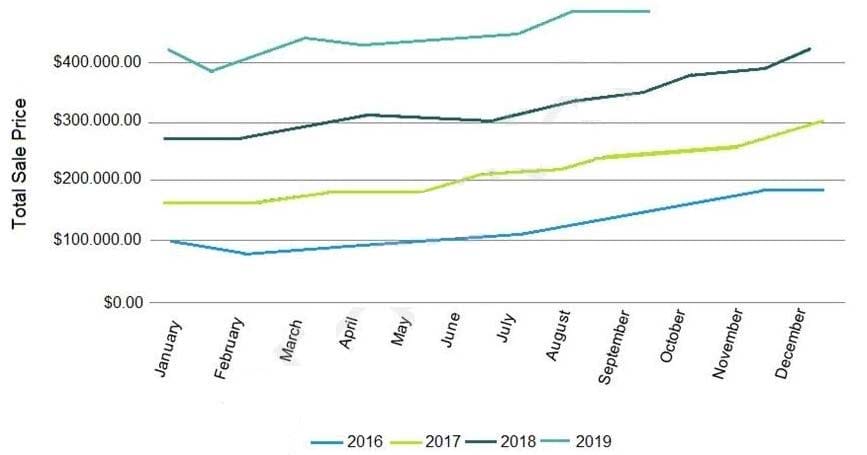
How should the analyst, in addition to selecting the measure Total Sales build the report?
A. Select the dimension Created Month, and pivot on the dimension Created Year.
B. Select the dimension Created Year, and pivot on the dimension Created Month.
C. Select the dimension Created Month Name, and pivot on the dimension Created Year.
D. Select the dimension Created Year, and pivot on the dimension Created Month Name.
An analyst for a movie producer is making an Explore query to show total box office revenue by movie. The initial query has three dimensions:
Ticket Purchase Month Movie Name Ticket Revenue
The analyst notices that the numbers look a lot smaller than expected and the results are difficult to
understand.
What should the analyst do to make the Explore query show the desired metric?
A. Remove the Month dimension and the Ticket Revenue dimension from the query. Add the Sum Revenue measure.
B. Remove the Ticket Revenue dimension from the query. Add the Sum Revenue measure.
C. Add the Sum Revenue measure to the query.
D. Add a table calculation that sums the Ticket Revenue dimension.
A business analyst is using the Totals check box in an Explore to get the sum of a column of values. The number that appears in the Total row is much higher than the analyst expects, and this number is not the sum of the values in the column.
What is a possible cause of this discrepancy?
A. There is a row limit applied.
B. There is a filter on a dimension.
C. There is a problem with the underlying LookML.
D. There is a column limit applied.
An analyst has a dashboard with a single filter on Created Date "is in the past year", but a tile on the dashboard is returning results for only the past 7 days. When the analyst selects "Explore from Here" on the tile, there are filters on both Created Date "is in the past year" and Created Time "is in the past 7 days".
How should the analyst make sure that only the filter set on the dashboard is applied to the tile?
A. After selecting Explore from Here on the tile, remove the filter on Created Time and hit Save.
B. After selecting Edit on the tile, add a filter on Created Date and hit Save.
C. Edit the dashboard Created Date filter to update the tile's Created Time field under Tiles to Update.
D. Edit the dashboard Created Date filter to update the tile's Created Time filter under Filters to Update.
A business analyst is filtering for this year's data in an Explore. There is a requirement to show future dates for this year in the visualization, even though those dates do not yet have associated data.
Where should the analyst go to make sure dates are filled in for the future?
A. X-axis settings
B. Column settings
C. Explore settings
D. Row settings
The query below shows how many uses purchased an item from each of two clothing departments.

Why are the total and sum of the rows unequal?
A. There is a filter limiting the count in the Total row.
B. There is a faulty logic in the way users relate to clothing departments.
C. A user is only counted once in the total even if the user has purchased from both departments.
D. There are users who have never purchased a clothing item from either department.
An analyst works on the data team at an organization that maintains multiple similar Explores. The analyst has access to see every Explore, but knows that employees in the finance department only have access to explores tagged Finance.
There is an Employee Compensation Data Finance Explore that the finance department has access to. The analyst usually uses an All Employee Data Explore that also includes personally identifiable information.
What should the analyst do to ensure proper access if the analyst wants to send an example visualization to the finance team?
A. Create Merged Results with the Employee Compensation Data Finance Explore and the All Employee Data Explore, and send the URL of the Merged Results.
B. Use the Employee Compensation Data Finance Explore and send the URL of the Explore to the finance team.
C. Use the All Employee Data Explore, but use Looker's built-in Send functionality to email the visualization.
D. Use the All Employee Data Explore, add a filter to exclude personally identifiable information, and send the URL of the Explore to the finance team.
An analyst creates a dashboard that shows sales at an aggregate and then an individual level. This dashboard is slow to run, and the analyst sees a warning about how load times may be impacted in dashboards with more than 25 tiles.
What should the analyst create to make sure all data sources in this dashboard are connected but still load quickly?
A. Dashboard filter to specify which individual data shows
B. Two dashboards, one with aggregate and one with individual data
C. Two dashboards with a text tile to hyperlink from one dashboard to the other
D. Folder with all dashboard tiles for aggregate data and individual data.

Home | Contact Us | About Us | FAQ | Guarantee & Policy | Privacy & Policy | Terms & Conditions | How to buy
Copyright © 2025 pass4itsure.com. All Rights Reserved