C2090-621 Online Practice Questions and Answers
An author wants to include a corporate graphic in the Dashboard.
Which image format is supported?
A. SVG
B. BMP
C. TIFF
D. JPEG
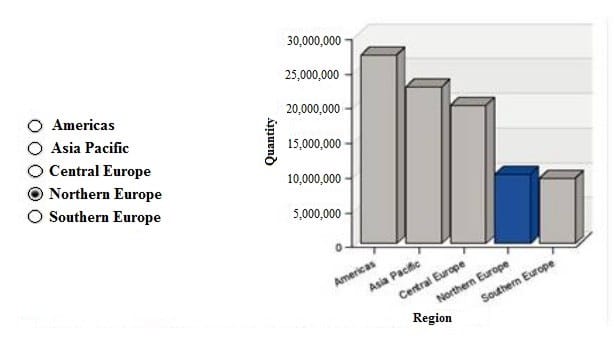
A report author has added a Button Bar control to an Active Report that allows users to view data for different regions. The report author now wants to make it possible for users to filter the report on multiple regions at once.
What should the report author do?
A. Use the Static version of the Button Bar control.
B. Use the Data-driven version of the Button Bar control.
C. Convert the Button Bar control to a Check Box Group control.
D. Convert the Button Bar control to a Radio Button Group control.
A company is using a model that was created in Compatible Query Mode (CQM). There is a report that must reference query subjects from two different packages.
How can this be accomplished?
A. The report author cannot create reports that reference multiple Data sources.
B. The report author can add multiple packages to the reports as Data sources and create the report as needed.
C. The report author must use SQL nodes for all queries that reference the data items in the two packages and join them appropriately to get the desired results within the report.
D. The report author can use user-defined SQL to develop the query from one of the packages and the other package to develop the other query and then join them appropriately to get the desired results within the report.
A report author wants to display Revenue and Quantity by Product line in one chart and use a combination chart. A bar chart is used for revenue and a line chart for quantity. While the bar chart is clear and easy to understand, the lines are almost missing and are different to read.
What can be done to solve the problem?
A. Use a conditional scale.
B. Build two charts next to each other.
C. Map Quantity to a y axis with a different scale.
D. Multiply Quantity by 1000000 and set the scale to -6 to display.
What happens when a report is run with full interactivity?
A. Consumers cannot drill-through.
B. Consumers can drill-down in Lists.
C. Consumers are able to make changes to the report.
D. Report consumers cannot save changes that are made.
A report author would like to create multiple variable connections in a report that contains one control and two Lists in order to compare data.
Which statement is true?
A. It is not possible to create two connections unless there are two different controls and two Lists.
B. The report author should be able to create two connections only if the values have the same data type.
C. The report author should be able to create one or more connections but the variable's Behavior should be the same.
D. The report author should be able to create multiple connections on one control by creating new connections, both variables can also show different Behavior.
A customer has a bar chart in a report that displays a steady increase in revenue by product line over time. The requirement is to graphically illustrate this progression in the data series without significantly the report.
How can this be done?
A. Add a linear trendline to the chart.
B. Add a polynomial trendline to the chart.
C. Create and insert graphics to highlight the data points.
D. Hide data values within the chart and make the bars larger.
A report author needs the label in a List column title to be dynamic.
How can this be implemented with a dynamic value?
A. Pivot the List to a Crosstab.
B. Create a Master detail relationship to the data.
C. Unlock the report and insert a data item into the List column title.
D. Select the List column title and change the Source type to Data item label.
A report author wants to generate an Active Report with a Chart, and allow the user to highlight a column within the Chart when a radio button is selected.
How should the report be created?
A. Using a Data deck.
B. Apply a client side filter.
C. Setting the Dynamic Chart property.
D. Setting the local processing property.
A report author was asked to create a report that displays Order method data within a List with a guide pointing to each Order method.
How can this be accomplished?
A. By creating a grouped list by Order method.
B. By creating data decks with lists filtering Order method.
C. By creating page breaks based on a data item and defining a grouping structure for the page set.
D. By adding a table of contents and a table of contents entry next to the order within the List.

Home | Contact Us | About Us | FAQ | Guarantee & Policy | Privacy & Policy | Terms & Conditions | How to buy
Copyright © 2025 pass4itsure.com. All Rights Reserved