C2090-011 Online Practice Questions and Answers
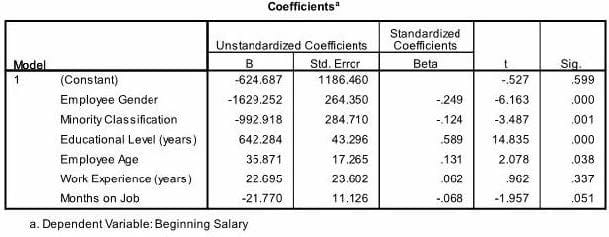
Which interpretation is correctfor this Regression Coefficients table?

A. For every additional year that you get older, your beginning salary decreases on average by $13.
B. For every additional year that you get older, your beginning salary decreases on average by $35.9.
C. Forevery additional year that you get older, your beginning salary increases on average by $13.
D. For every additional year that you get older, your beginning salary increases on average by $35.9.
In order to access the New Custom Attribute feature in the Data Editor, the Data Editor must be viewed from the:
A. Value Labels button.
B. Dialog Recall button.
C. Data View tab.
D. Variable View tab.
If you build an expression manually, as opposed to using a function (e.g., specify (V1+V2)/2 instead of MEAN (V1 , V2)), which statement is true?
A. If any of the variables usedin the expression has a missing value, it will be ignored and the expression will proceed to evaluate with variables that have valid values.
B. It will always return a valid value for each case, regardless of whether one or more of the source variablevalues are missing.
C. If any of the variables used in the expression has a missing value, the result for that case is a system-missing value.
D. If any of the variables used in the expression has a missing value, you will get a notification pointing thisout before you proceed.
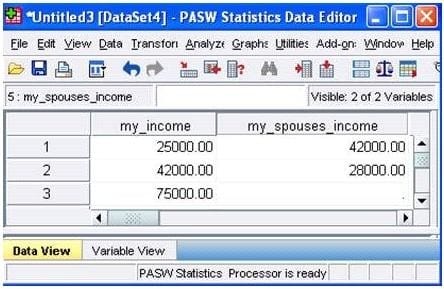
Consider two variables, my_income and my_spouses_income, in the dataset below. You created a third variable, total_income using the Compute Variable dialog and the following expression: total_income = my_income + my_spouses_income. True or false: the value for the 3rd case will be a system-missing value.

A. True
B. False
Consider the table below. Which IBM SPSS Statistics dialog was used to generate it?

A. The Crosstabs... dialog
B. The Means... dialog
C. The Case Summaries.., dialog
D. The Select Cases... dialog
Which statement is true about IOR (inter quartile range)? (Choose two.)
A. It is used to measure the spread ofthe data.
B. It is equal to the mode.
C. It is the range between the values at the 25111 and 75111 percentile.
D. It indicates whether the variable is normally distributed or not.
An Independent Samples T-Test can be used to test whether there is a significant difference between the incomes of males and females.
A. True
B. False
What type of graph would you use to see the distribution of a scale variable?
A. Barchart
B. Pie chart
C. Histogram
D. Scatter plot
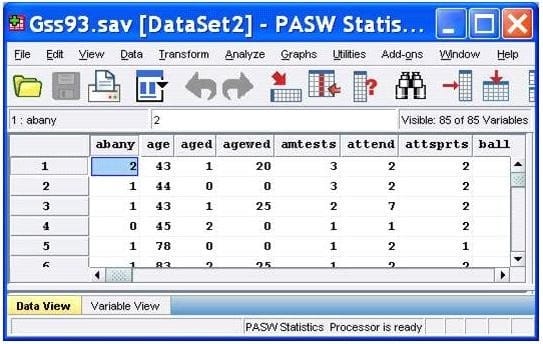
After studying the figure below1 select the correct statement.

A. Gss93.sav is the dataset name.
B. DataSet2 is the dataset name.
C. DataSet2 is the file name.
D. DataSet2 is both the file and dataset name.
If you use the IBM SPSS Statistics Select Cases dialog to conduct analysis on a subset of cases and you want to keep all cases in the same dataset, which option is appropriate?
A. Copy unselected cases to a new dataset
B. Copy selected cases to a new dataset
C. Filter out unselected cases
D. Delete unselected cases

