499-01 Online Practice Questions and Answers
How do you control the overhead of AppInternals Xpert agents?
A. Install agents on a limited number of machines.
B. Restart the server.
C. Agents self tune so there is no need to control the overhead.
D. Never install more than 5 agents.
E. Use multiple consoles.
F. Unplug the server.
Each of the "dots" you see in the BrowserMetrix user interface represent:
A. An end-user page view
B. The web server tier
C. The web application
D. The server node for the transaction
What is the default limit for URLs that can be monitored?
A. 100 URLs
B. 1,000 URLs
C. 10,000 URLs
D. Unlimited
Highlighting the top 10 listed IP addresses in an IP table and then clicking the "Multi-Group Metric Time Series Chart" icon in the toolbar delivers what result?
A. It graphs the throughput of the first listed IP.
B. It sums the throughput for the highlighted IP addresses and then graphs the result.
C. It graphs the throughput for each of the highlighted IP addresses overlaid on the same graph.
D. It does nothing, as more configuration is needed.
How can you capture traffic when using the AppTransaction Xpert capture agent? (Select 3)
A. From AppTransaction Xpert, use the AppTransaction Xpert capture manager
B. From AppSensor Xpert, when defining synthetic tests
C. From AppResponse Xpert, use the packet download manager
D. Using the distributed agent controller
E. From the packet trace warehouse
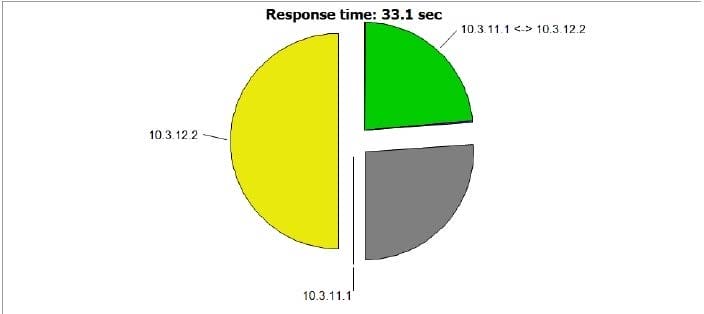
Refer to the exhibit.

In the diagram, what does the gray wedge signify?
A. Unidentified traffic
B. Parallel effects
C. Protocol effects
D. User think time
Which of these would you use to determine how varying latencies, bandwidths, and other network parameters affect an application transaction's performance?
A. Quick predict
B. Path probe
C. AppDoctor
D. Distributed agent controller
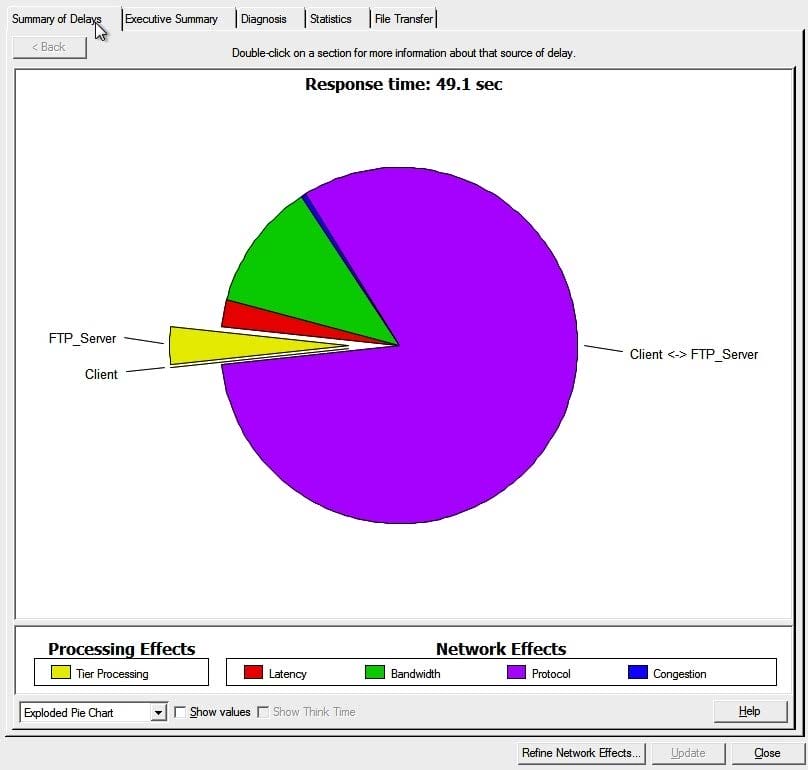
Refer to the exhibit from the AppDoctor.

The primary bottleneck is probably due to:
A. Processing at client
B. Chattiness
C. Packet loss
D. Processing at server
E. Latency
Which of the following statements are true? (Select 3)
A. By default, anyone who can authenticate to the OPNET Authorization Server can create their own dashboard.
B. Dashboards can be shared so that authentication is not required, and right-click integration is fully functional.
C. Being able to view a dashboard panel lets you adjust its time range and copy the panel to your own dashboard for further editing.
D. External content can be inserted into any dashboard by using the Auxiliary Panel content type.
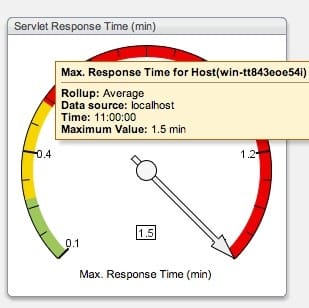
Refer to the exhibit.

Given that the gauge is at its maximum point, which of these statements apply? (Select 2)
A. The threshold values came from the data source, AppInternals Xpert.
B. The absolute worst response time in the dashboard's time range was 1.5 minutes.
C. The gauge is actually showing the minimum maximum value.
D. The gauge's value is the average of the maximum servlet response times for the dashboard's time interval.

